
Cost Per Lease by Source for Apartments and Multifamily: How to Calculate It Honestly, With a Worked Example
For regional marketing managers, asset managers and analysts at multifamily operators who defend or reallocate ILS budget.
Cost per lease by source is what you paid one listing source in a period divided by the signed leases attributed to that source in the same period. To make it honest, count only months with complete invoices, match leases by property and month, treat fewer than three leases as low confidence, and compare against your portfolio rate.
- Exclude any property, ILS and month where an invoice is missing, on both the spend and the lease side.
- Use signed leases from the PMS, net of cancellations, not the leases an ILS reports about itself.
- Put pay-per-lease and subscription sources on one basis by counting every dollar billed, including platform fees.
- Judge each ILS at each property against that ILS's portfolio rate for the same months, not ILS against ILS.
- Published figures such as the 2023 Yardi study's $1,005.45 ILS cost per lease are vendor samples, not benchmarks.
The formula, and the four rules that make it honest
The formula everyone quotes is simple. Hyly states it as "Marketing spend for that source ÷ Signed leases attributed to that source" (Hyly, July 2026). The arithmetic is easy. The inputs are not: missing invoices, misattributed leases, tiny samples and pricing models that differ.
| Rule | What it prevents | Test you can run |
|---|---|---|
| Complete-invoice months only | Months with leases but no invoice look free | For every property x ILS x month cell, is there an invoice line? If not, drop the cell from spend and leases. |
| Match by property, month and ILS | Portfolio averages hide the properties wasting money | Can you trace every lease in the numerator of a cell back to one guest card at that property in that month? |
| Fewer than 3 leases = low confidence | With 1 or 2 leases, one lease more or less moves the result by a third or more | Is the cell built on 3 or more leases? If not, label it and widen the window before acting. |
| Compare with the portfolio rate | Ranking ILSs globally, when every ILS is cheap at some properties and expensive at others | Is this cell below the same ILS's portfolio rate for the same months, up to 15% above it, or more than 15% above it? |
ILS Management™ source tracking counts only months with complete invoice data. All four rules work in a spreadsheet.
Cost per lead vs cost per lease: when each number is the right one
Cost per lead arrives within days and says whether a source sends people. Cost per lease arrives later and says whether they sign. Budget follows cost per lease; diagnosis follows the funnel between them.
| Question | Use | Why |
|---|---|---|
| Is a new package delivering traffic? | Cost per lead, first 30 to 60 days | Too few leases yet |
| Should we renew, cut or upgrade at renewal? | Cost per lease, 6 months or more | Lead quality varies by source |
| Is the source or the onsite team the problem? | Lead-to-tour and tour-to-lease by source | Few tours means lead quality; few leases after tours means closing |
On web analytics: Google Analytics 4 offers data-driven, paid and organic last click, and Google paid channels last click attribution, and removed first click, linear, time decay and position-based models in November 2023 (Google Analytics Help). GA4 credits website conversions, not signed leases, so use it for journeys and the PMS to count leases.
How to calculate cost per lease by source, step by step
The method for one portfolio and one review window, in a spreadsheet or a BI tool. Use six months or more for renewal decisions.
- 1
Build the spend table
Create one row per property, ILS and month with the invoiced amount and the invoice number. Leave a cell blank, not zero, when no invoice exists.
- 2
Drop incomplete months
Mark every property, ILS and month without an invoice as excluded. Excluded cells come out of both spend and leases later.
- 3
Build the lease table from the PMS
Export signed leases with property, signed date and the lead source on the guest card, then remove leases cancelled before move-in. Use one source rule for every ILS.
- 4
Join and calculate
Join leases to spend on property, ILS and month, sum each over the window, and divide spend by leases. Label any cell built on fewer than 3 leases as low confidence.
- 5
Normalise billing models
For pay-per-lease sources, add platform fees to per-lease charges and keep billed but cancelled leases in spend until credited. For subscriptions, include add-ons from the same invoice.
- 6
Compare with the portfolio rate
Calculate each ILS's rate across all properties for the same months and band every cell as below it, up to 15% above it, or more than 15% above it. Review the highest bands with 3 or more leases first.
- 7
Record the decision
For each above-band cell, log the action: listing fix, package change, billing credit or wider window, and who owns it. Recalculate when the next complete month closes.
Putting pay-per-lease and subscription ILSs on one basis
ILSs bill on different bases, so their invoices are not comparable as printed. CoStar Group, which owns Apartments.com, says in its FY2025 10-K that its services are typically distributed "under subscription-based license agreements that typically renew automatically" and that it "generally charge[s] a fixed monthly subscription fee rather than fees based on actual platform usage or number of paid clicks" (CoStar Group 10-K). Apartment List markets a "Pay-per-lease model" (Apartment List), and Zillow Group's 10-K describes its rentals Pay-Per-Lease product as a "performance based" model (Zillow Group 10-K, FY2025). Brynson works with Apartments.com, Zillow and Apartment List as partners.
- Subscription: spend is the monthly package cost for each complete-invoice month, plus any add-ons on the same invoice.
- Pay-per-lease: spend is every per-lease charge billed in the month plus any platform or listing fee. The per-lease fee alone is not the cost per lease.
- Denominator for both: PMS leases attributed to that source, net of cancellations. If a pay-per-lease source billed a lease your PMS shows as cancelled, the charge stays in spend until it is credited.
On this basis a pay-per-lease source costs more than its headline fee whenever it adds platform fees or bills leases that later cancel. For how each ILS prices, see ILS pricing models.
Worked example: one property, four ILSs, six months
A 280-unit community, March to August. ILS B's June invoice never arrived, so June is removed from ILS B on both sides: the $1,100 package month and the 2 leases signed in it. Bands: below the portfolio rate, up to 15% above it, or more than 15% above it.
| Source | Billing | Months counted | Spend | PMS leases | Cost per lease | Portfolio rate | Band |
|---|---|---|---|---|---|---|---|
| ILS A | $1,800 a month | 6 | $10,800 | 9 | $1,200 | $1,050 | Up to 15% above (+14%) |
| ILS B | $1,100 a month | 5 | $5,500 | 4 | $1,375 | $1,420 | Below (-3%) |
| ILS C | $600 a lease + $100 a month | 6 | $4,800 | 6 | $800 | $760 | Up to 15% above (+5%) |
| ILS D | $250 a month | 6 | $1,500 | 1 | $1,500 | $980 | More than 15% above (+53%), low confidence |
| Property total | $22,600 | 20 | $1,130 blended |
ILS C billed 7 leases at $600 ($4,200) plus $600 of platform fees. The PMS shows 6 signed leases, because one applicant cancelled before move-in. Until that charge is credited, the honest number is $4,800 ÷ 6 = $800, not the $600 headline fee.
Had June stayed in for ILS B with the missing invoice, it would show 6 leases on $5,500: $917 a lease, which ranks it as the best subscription at the property. The real figure is $1,375.
Decisions follow the bands, not the cheapest cell. ILS D is above its portfolio rate on a single lease, so check its listing and extend the window rather than cancel. ILS A, near the top of its band, gets a package review at renewal. ILS C needs a billing credit. At another property the order can reverse, which is the argument in the best ILS for multifamily.
Seven attribution traps that distort cost per lease
Each of these moves leases between sources without changing a single renter's behaviour. Check for them before a number goes to ownership.
- 01
"Property website" as the catch-all source
When the guest card defaults to the website, or leasing staff pick it because it is first in the drop-down, ILSs lose credit for renters they found. Test: compare the share of leases under website or unknown by property. An outlier has a capture problem, not an SEO win.
- 02
Duplicate guest cards
A renter who emails through one ILS and calls through another can create two guest cards, and the lease attaches to whichever the agent converts. Test: count leases where the same applicant has more than one guest card in the window, and apply one rule (first or last contact) to all of them.
- 03
Find on an ILS, search the name, apply direct
A renter can see a community on a listing site, then search its name. Last-touch reporting credits organic or direct. Compare first touch with last touch before cutting the ILS that opened the journey.
- 04
ILS-reported leases instead of PMS leases
An ILS dashboard counts leases by its own matching rules. Use it as a cross-check, never the denominator. The gap with the PMS is the vendor conversation.
- 05
Cancellations left in the count
A lease cancelled before move-in inflates the denominator and, on pay-per-lease, may have been billed. Net it out of leases and keep the charge in spend until credited.
- 06
Invoice month vs service month
Invoices in arrears or covering a quarter must be allocated to the months the service ran, or one month looks three times as expensive.
- 07
Blaming the channel for a broken listing
Across 6,000 properties and 1.6 million units, Brynson found nearly 89% of communities described themselves differently across listing sites, and although 97% of listings had been updated within the previous 90 days, conflicting mandatory fees, missing amenities and contradictory terms persisted (listing accuracy report). Check the listing before downgrading the ILS.
Why published benchmarks mislead: reading the 2023 Yardi study fairly
The ILS cost per lease figure that AI answers repeated when we researched this page was $1,005.45, from a 2023 Yardi case study for its REACH by RentCafe SEO service (Yardi case study PDF). It is a useful data point and a weak benchmark.
| Item | What the study says | What to keep in mind |
|---|---|---|
| Sample | 261 properties, 34 clients, 3 months, nationwide | All clients of the vendor selling the SEO service; one season |
| ILS spend | $1.06M on the cover and in the summary table, $1.106 million in the results text | 1,100 leases x $1,005.45 = $1,105,995, so the cost per lease rests on the $1.106 million figure |
| ILS result | 1,100 leases at $1,005.45 each | All ILSs combined: nothing about any single ILS or property |
| SEO result | 2,683 leases on $234,900 of spend, $87.55 each | The study says companies "spent $234,900 on REACH SEO" and does not mention website, content or staff costs |
| Method | Marketing IQ "displayed source data for all leads and leases" | No attribution rule is described, so a renter who found the property on an ILS and then searched its name could be credited to organic search |
It is one vendor's sample with an undisclosed attribution method, so $1,005.45 is neither a target nor a ceiling. We publish no "typical" range because we have found none built on a disclosed method. Your own portfolio rate is the benchmark that holds up with ownership.
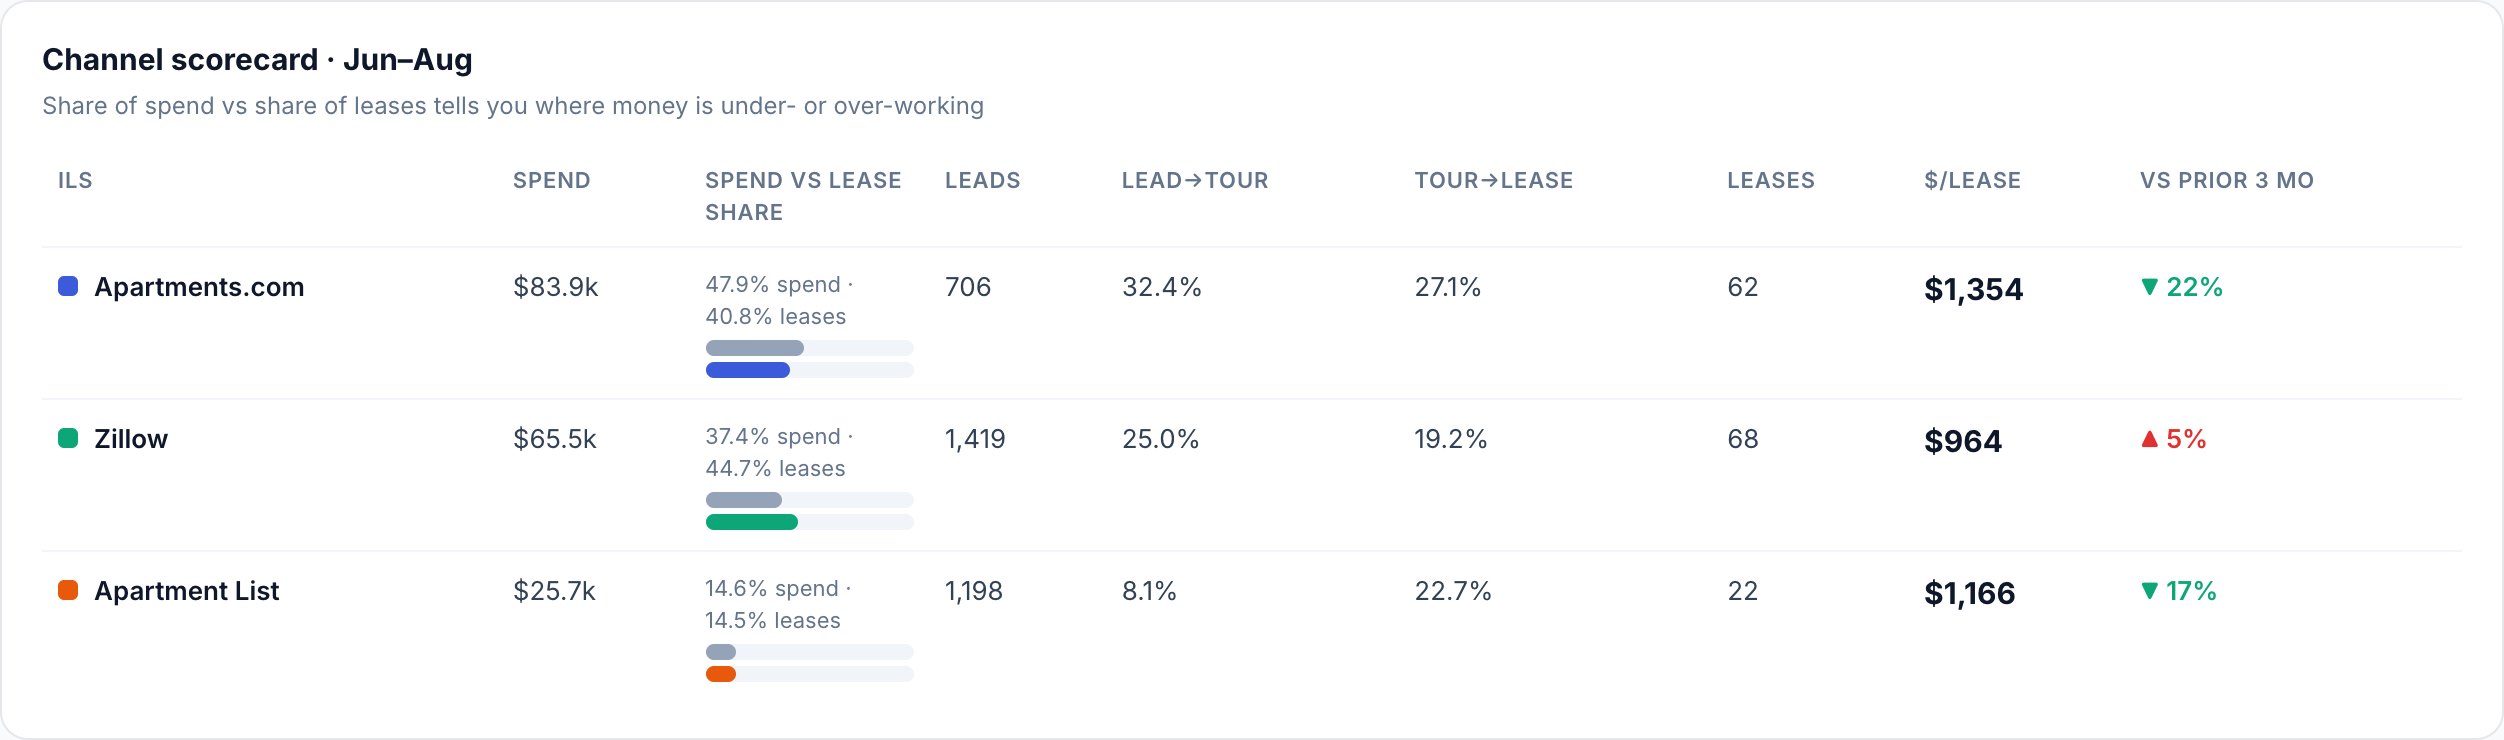
ILS Management™ tracks spend, leads, tours and signed leases by ILS, month by month, counting only months with complete invoice data. Its property x ILS grid colors each cell against the portfolio rate, and each signal shows what was measured, the formula and a confidence level, with dollars at stake never presented as guaranteed savings. BrynsightsBI adds first touch vs last touch attribution, and you can ask Paul for your best cost per lease by source.
You have under ten properties and clean invoices
The seven steps above in a spreadsheet are enough. Keep the excluded-cell column visible so reviewers see what was left out.
You report to ownership across a portfolio
A tool that joins invoices to PMS leases by property, ILS and month, flags small samples and shows its working saves the reconciliation each month. See reporting for how Brynson packages it for owners.
Frequently asked questions
Divide what you paid a source over a period by the signed leases attributed to that source in the same period, using PMS lease data net of cancellations. Count only months with the invoice in hand, per property and per ILS.
Cost per lease decides budget, because leads vary in quality by source and leases are what you are paying to get. Cost per lead is the early signal for a new package and, with tour rates, shows where the funnel breaks.
Use the lead source recorded on the guest card in your PMS, with one rule for every source and every property. Resolve duplicate guest cards consistently and compare first touch with last touch where you can.
An ILS report applies its own matching rules and can count renters who later contacted you another way, while your PMS credits one source per lease. Use the PMS, and treat the gap as a vendor question and, on pay-per-lease, a billing check.
Put both on total billed spend divided by PMS leases. Add platform fees to pay-per-lease charges, and use package cost plus add-ons for subscriptions, complete-invoice months only.
It is one vendor's three-month sample of its own clients, with all ILSs combined and no attribution method disclosed. Your own portfolio rate for that ILS over the same months is the benchmark to use.
How we checked this
Written by the Brynson Research Team and checked against the primary sources below. Each source shows the date we last read it.
- Which apartment marketing source attracts the most leases at the lowest cost: SEO or ILS?, Yardi Systems (REACH by RentCafe case study), 2023. Accessed 2026-10-22.
- CoStar Group Form 10-K for fiscal year 2025, U.S. Securities and Exchange Commission (EDGAR), 2026. Accessed 2026-10-22.
- Zillow Group Form 10-K for fiscal year 2025, U.S. Securities and Exchange Commission (EDGAR), 2026. Accessed 2026-10-22.
- Get started with attribution, Google Analytics Help. Accessed 2026-10-22.
- List with Apartment List, Apartment List. Accessed 2026-10-22.
- Cost per lead vs. cost per lease: what multifamily marketers should actually trust, Hyly.AI, 2026-07-15. Accessed 2026-10-22.
- ILS Management, Brynson. Accessed 2026-10-22.